Operational Status
The Operational Status page is the default Statistics view — a single page that combines an outbound summary and an inbound summary for the selected time window.
Page Layout
The page header reads Operational Status.
Filters
A horizontal filter bar at the top of the page:
| Field | Purpose |
|---|---|
| All Domains | Dropdown — narrow to a single domain or include all domains in the group |
| 1 day | Period preset — 1 day, 1 week, 1 month, etc. |
| Start datetime | Start of the reporting window (YYYY-MM-DD HH:MM) |
| End datetime | End of the reporting window (YYYY-MM-DD HH:MM) |
| Search (blue) | Apply the filters and refresh the tables below |
| Print (icon) | Print or export the visible report |
Outbound Operation Status
The first table on the page summarizes outbound traffic.
| Column | Description |
|---|---|
| Date | Day the counters apply to |
| Total | Total outbound messages processed |
| Clean | Messages classified as Safe and delivered |
| Approved | Messages held for approval and then released |
| Text Blocked | Messages blocked by content rules (PII, keyword) |
| Account Blocked | Messages blocked because the sending account was suspended |
| Malware Detected | Messages blocked because they contained malware |
| Relay Blocked | Messages blocked because the sender attempted unauthorized relay |
Inbound Operation Status
The second table summarizes inbound traffic with a richer breakdown:
| Column | Description |
|---|---|
| Date | Day the counters apply to |
| Total | Total inbound messages processed |
| Delivered Safe (Not Delivered) | Messages classified as Safe (column also reports any that the user later marked as not delivered) |
| Delivery Failed | Messages SGuard accepted but failed to hand off downstream |
| Rejected (Clean) | Messages classified as Clean but rejected by another rule |
| SPAM | Messages routed to the Spam mailbox |
| DKIM Fail | Messages routed to the Block DKIM mailbox because DKIM verification failed |
| Whitelist | Messages delivered because of a Whitelist rule |
| Blacklist | Messages blocked because of a Blacklist rule |
| URL Blacklist | Messages routed to the URL Blacklist mailbox |
| Malware Detected | Messages routed to the Malware mailbox |
| Bulk Mail Limit | Messages held back because they exceeded the bulk-sending threshold |
Reading the Numbers
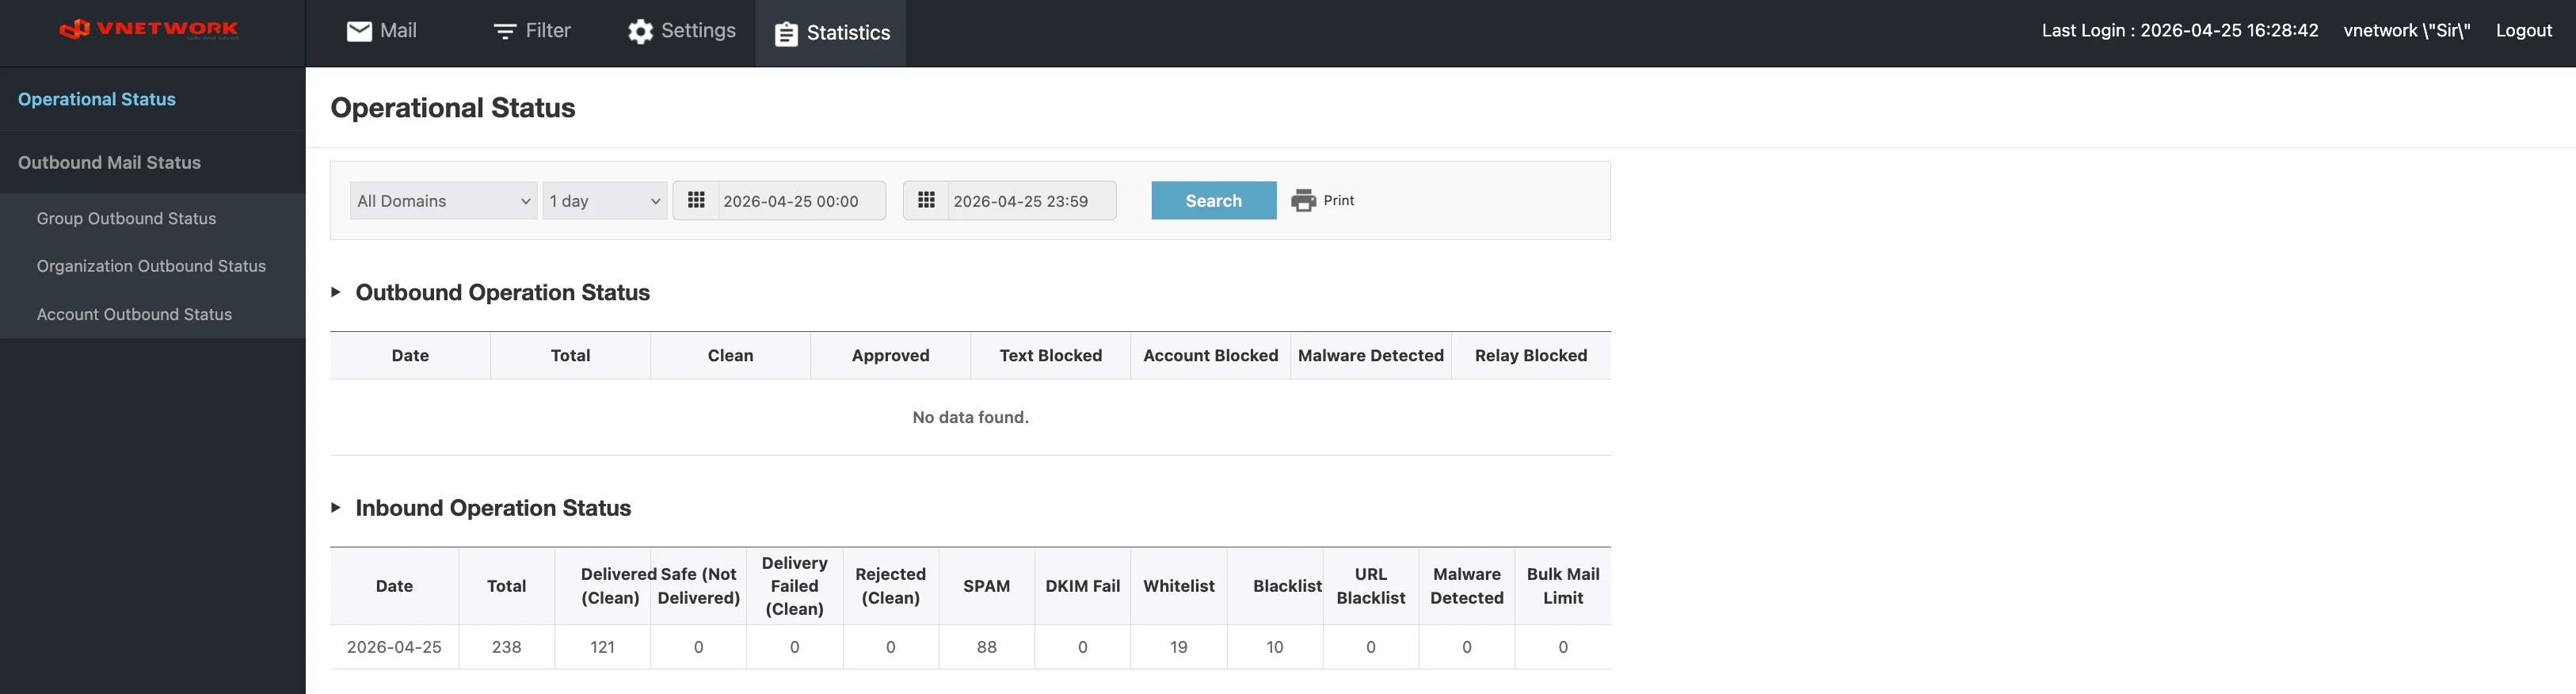
The two tables together describe the entire pipeline. A typical day for one group might look like:
- Inbound Total = 238, of which 121 were
Delivered Safe, 88 went toSPAM, 19 wereWhitelist, 10 wereBlacklist - Outbound Total = 0, with no breakdown row visible
Compare day-over-day to spot:
- A spike in
SPAMorBlacklist(campaign in progress) - A drop in
Delivered Safepaired with a rise inBulk Mail Limit(a sender flooding the system) - A rise in
DKIM Fail(a configuration regression on a partner domain)
tip
Use the Print icon to capture a daily snapshot for handover or change-tracking. Pair the snapshot with the Period datetime so the report is reproducible.