Monitors
A monitor (watchpoint) is one check that runs on a schedule and reports Up or Down. The Monitors page lists every watchpoint in the project.
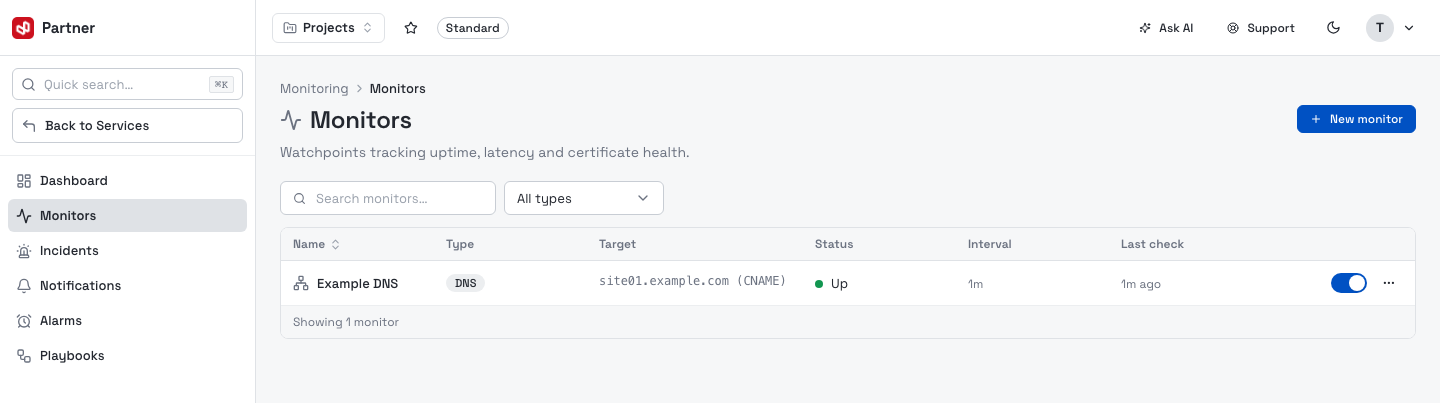
Columns: Name, Type, Target (URL / host:port / record), Status (Up / Down / Paused), Interval, Last check, and Actions — a pause/resume toggle plus a row menu (Edit, Delete). Search by name, and filter by type with the All types dropdown.
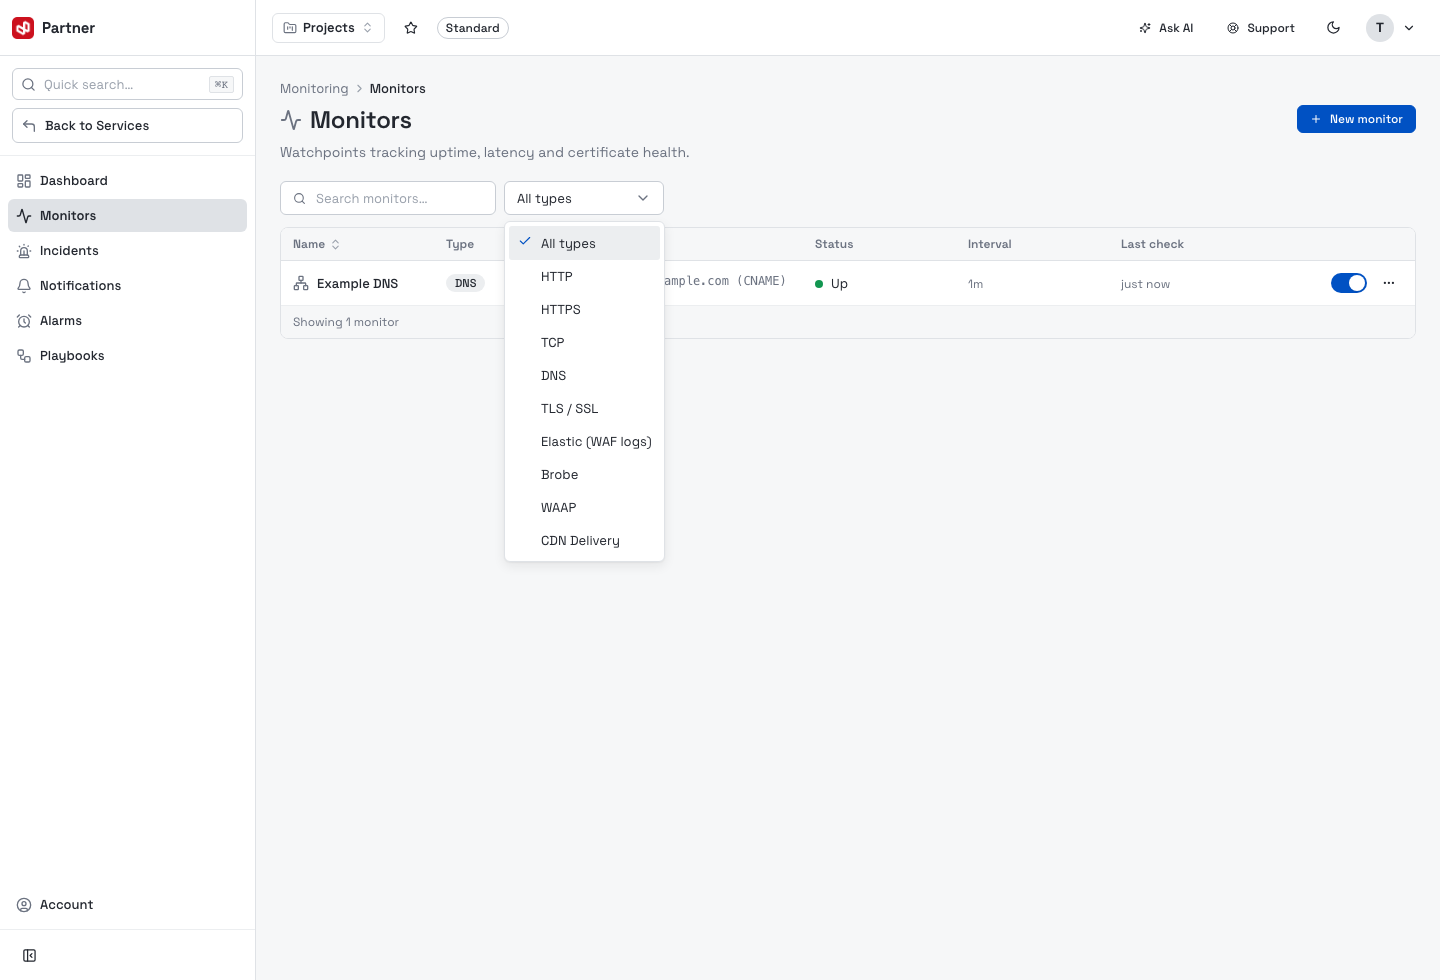
Monitor types
Two families of check are available, chosen on the first step of the create wizard:
| Type | Group | What it checks |
|---|---|---|
| HTTP / HTTPS | Protocol | Endpoint status code, response body and latency. |
| TCP | Protocol | TCP port reachability. |
| DNS | Protocol | DNS record resolution and expected values. |
| TLS / SSL | Protocol | Certificate validity and days-to-expiry. |
| Elastic (WAF logs) | Data-driven | An Elasticsearch WAF-log aggregation. |
| Brobe | Data-driven | A custom probe-engine query. |
| WAAP | Data-driven | A WAAP security-dashboard metric. |
| CDN Delivery | Data-driven | A CDN delivery metric. |
Create a monitor
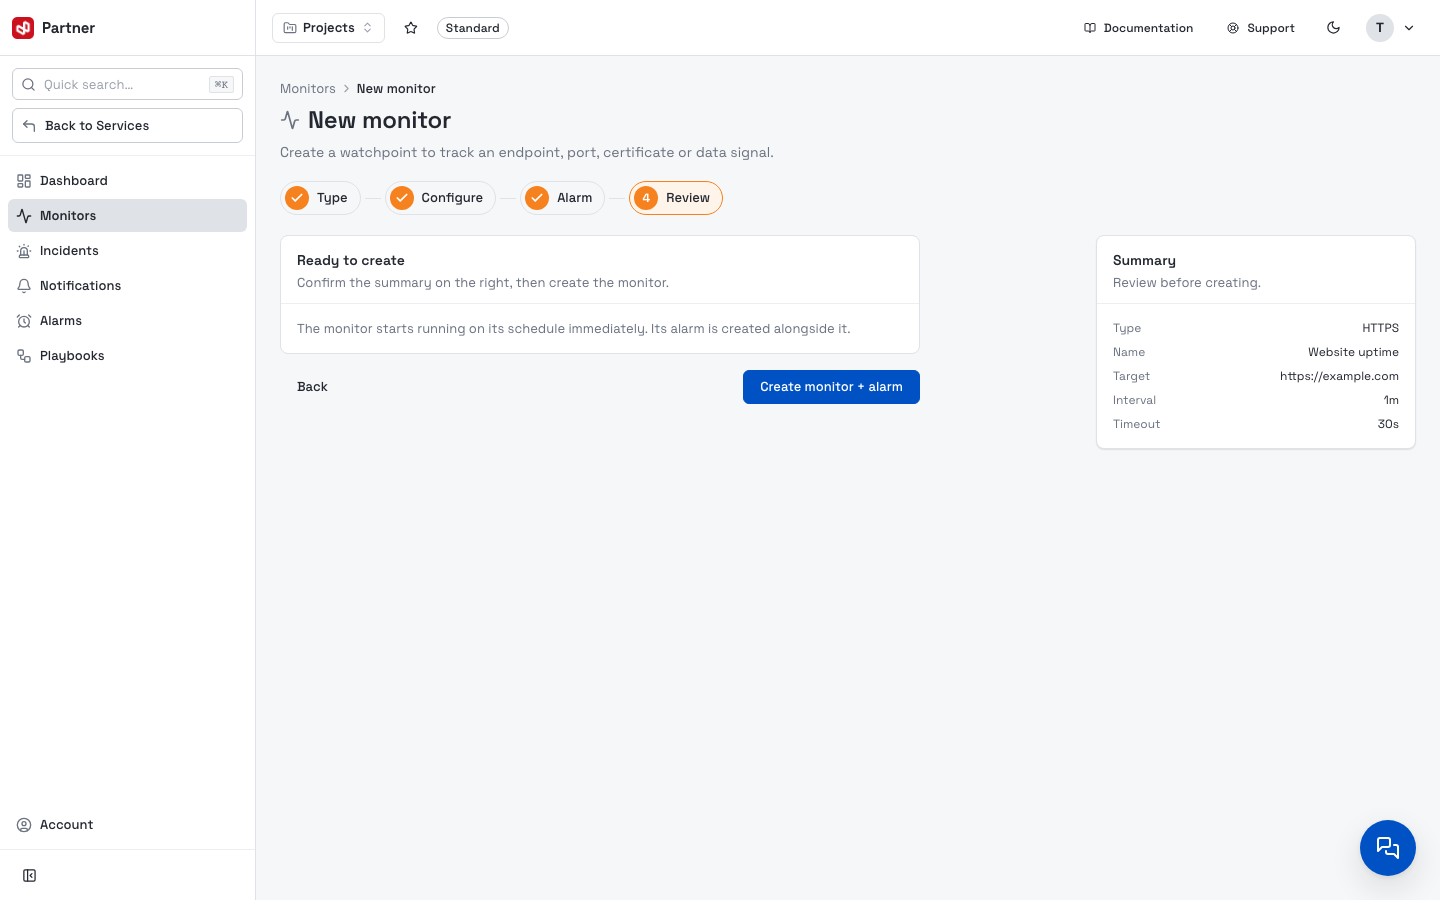
New monitor opens a four-step wizard — Type → Configure → Alarm → Review — with a live summary on the right.
Start from a template
The Type step leads with a template gallery — ready-made monitors for common goals, grouped by intent (Availability, Certificate, Traffic & Security, WAAP / CDN). Pick one and the wizard pre-fills the configuration and a matching starter alarm, so you only tweak the target. Anomaly templates (single-IP flood, distributed scan, 5xx surge) use the σ operator — no threshold to guess.
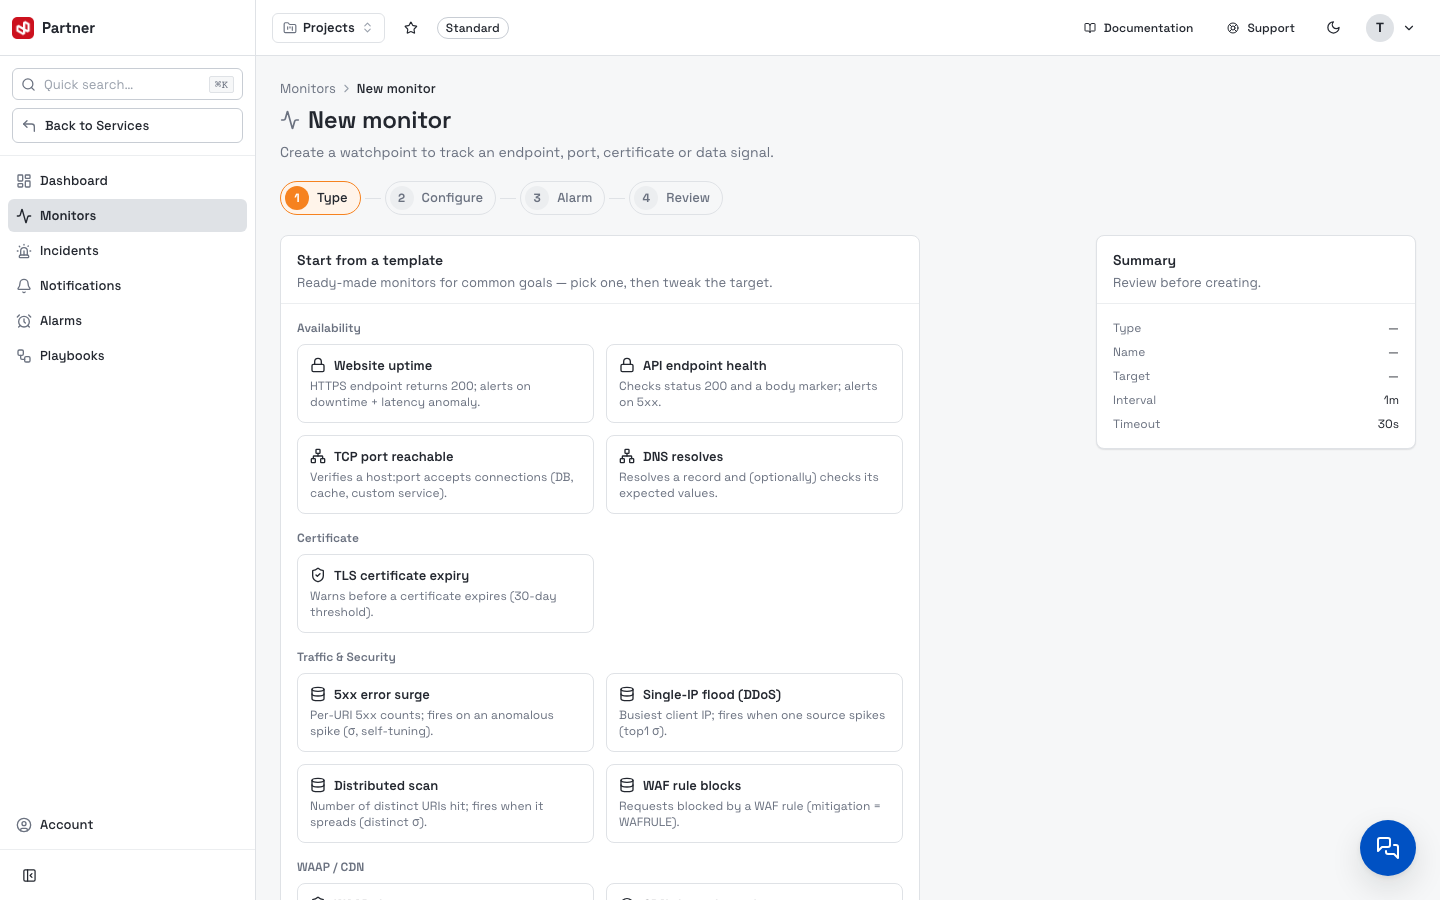
1. Type
Or build from scratch: pick the check type from the Protocol monitors or Data-driven monitors groups.
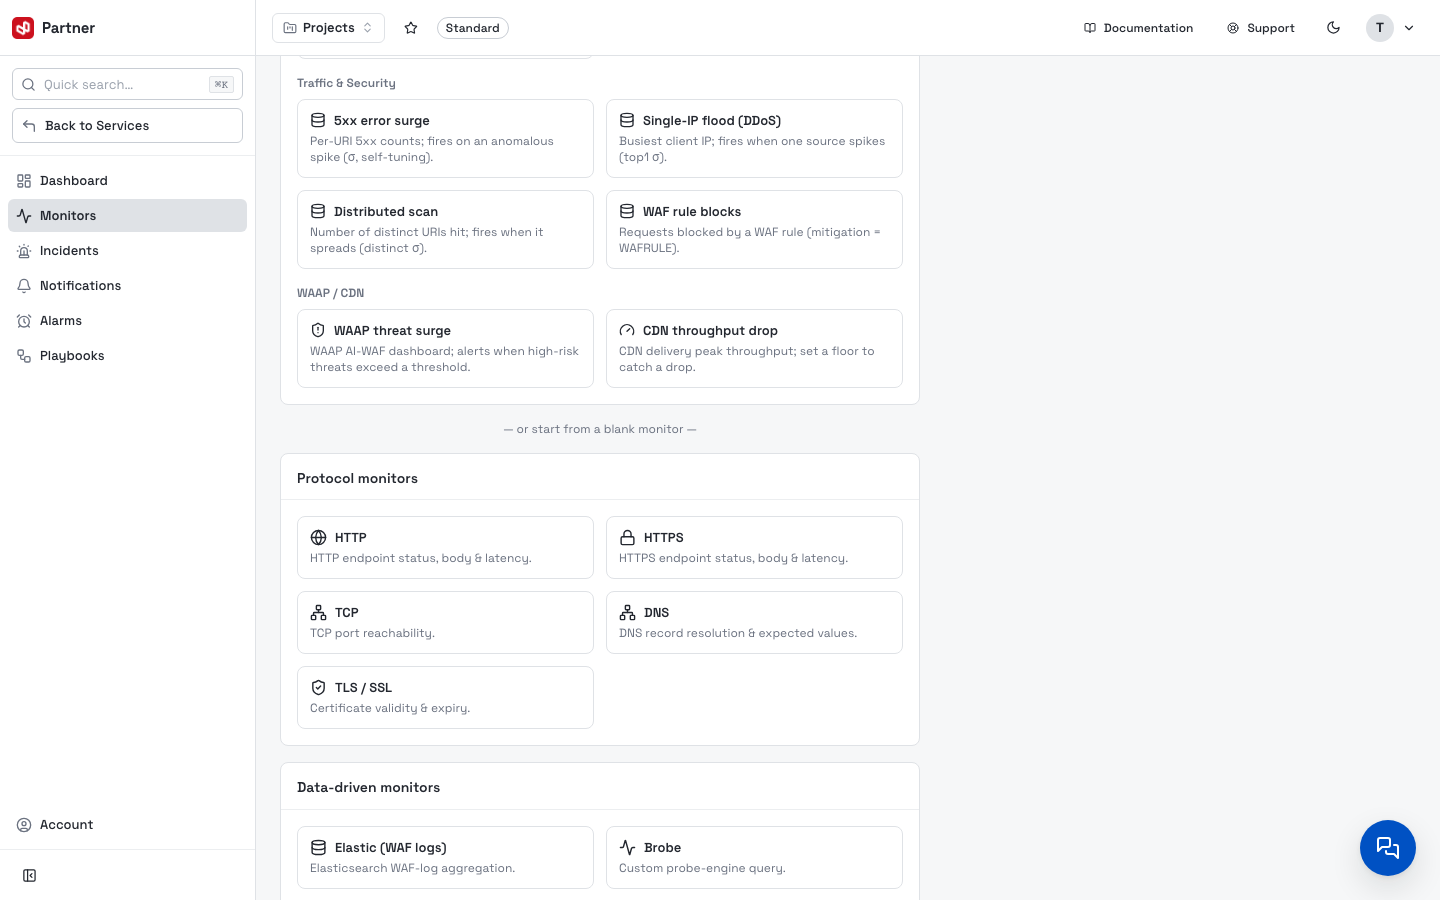
2. Configure
Give the monitor a Name, fill the type-specific configuration, and set the Schedule (check Interval and Timeout, both in seconds).
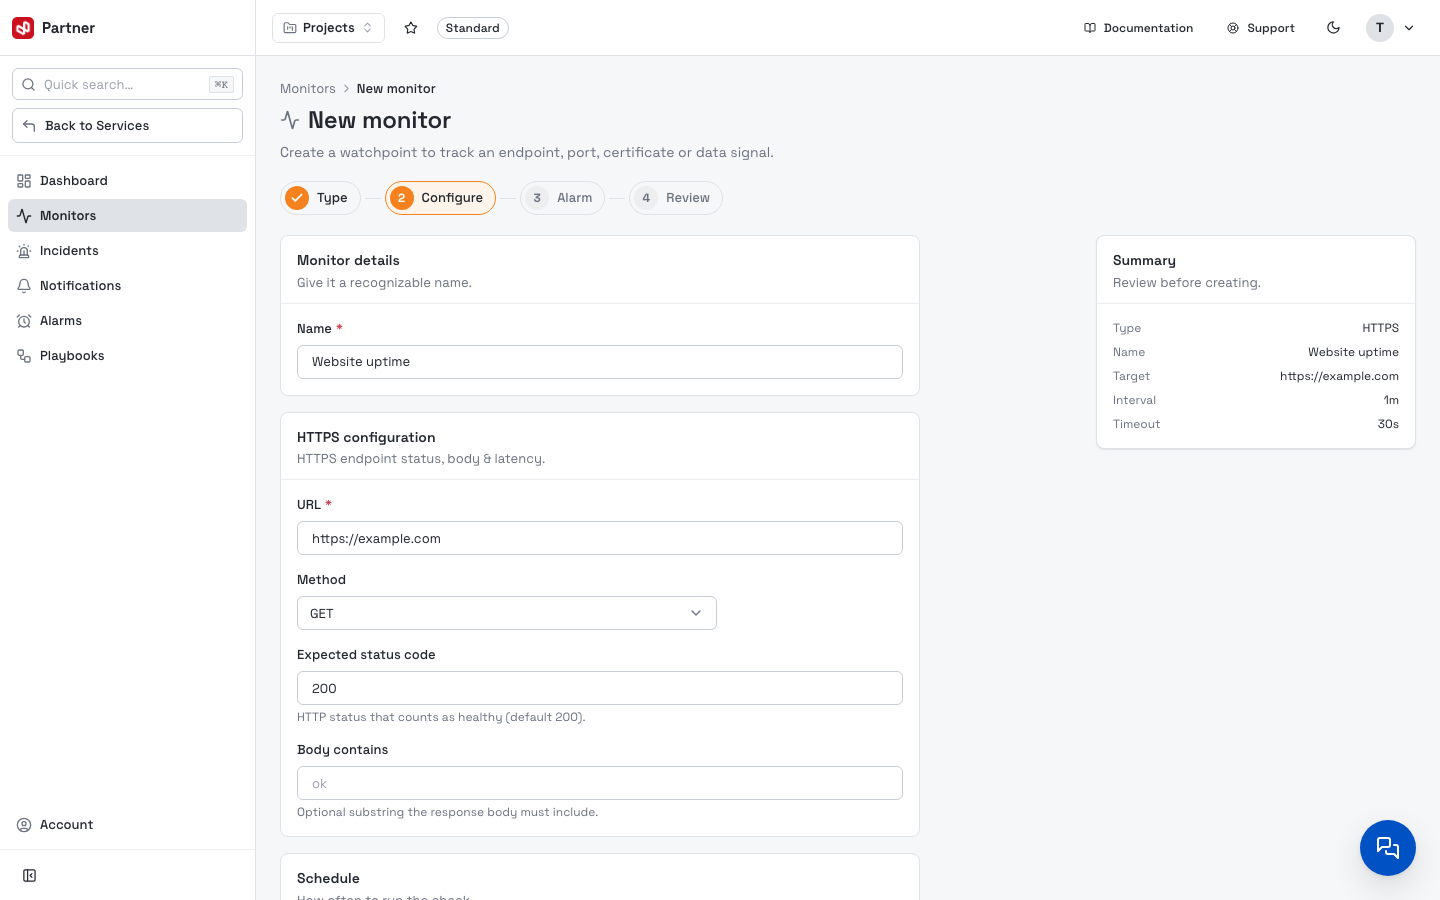
The configuration fields depend on the type:
| Type | Fields |
|---|---|
| HTTP / HTTPS | URL (required) · Method (GET / HEAD / POST / PUT) · Expected status code (default 200) · Body contains (optional substring). |
| TCP | Host (required) · Port (required). |
| DNS | Host (required) · Record type (A / AAAA / CNAME / MX / TXT / NS) · Expected values (comma-separated) · Nameserver (optional resolver override). |
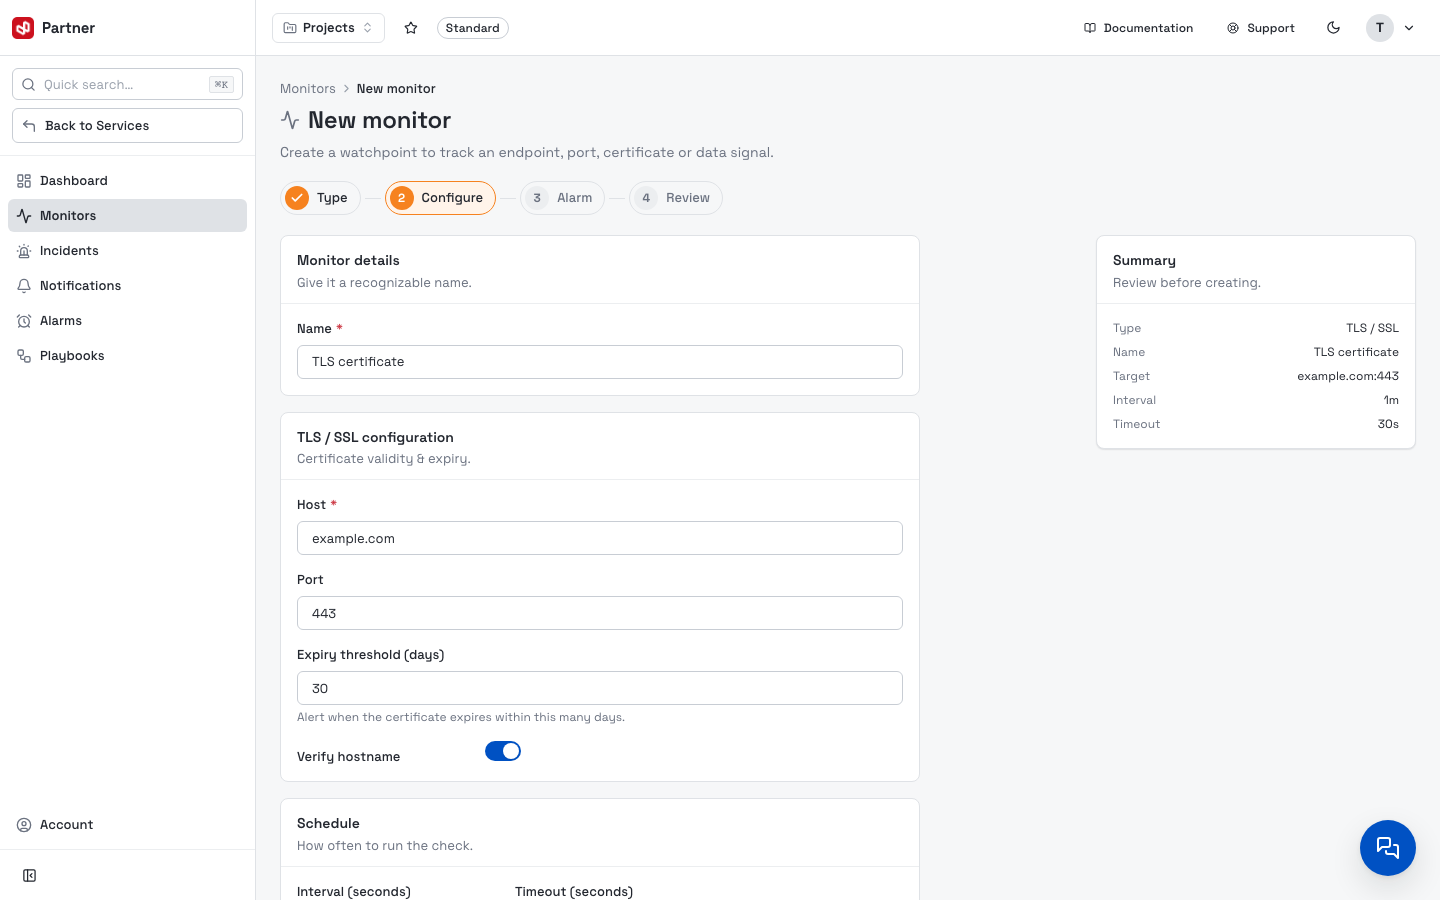
| TLS / SSL | Host (required) · Port (default 443) · Expiry threshold (days) · Verify hostname. |
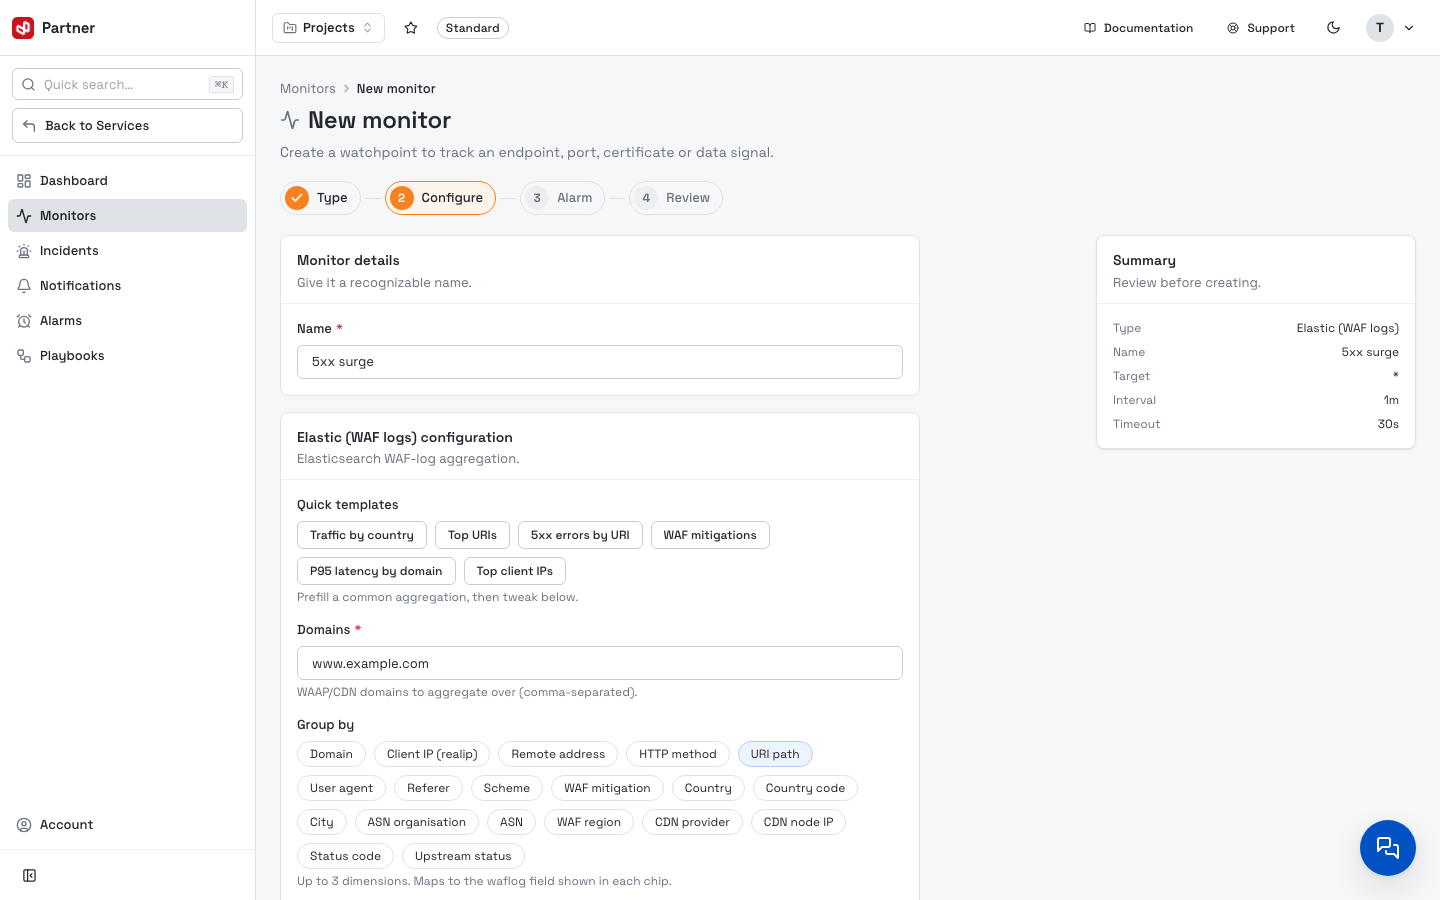
| Elastic (WAF logs) | Domains · Group by dimensions (up to 3) · Metric · Filters · Evaluation window, with quick templates. |
| WAAP / CDN Delivery | Customer ID (required) · Domains · Dashboard · Time range. |
A TLS / SSL monitor watches certificate health — it goes Down once the certificate is within your Expiry threshold (days), so you're warned before it lapses:
Data-driven types aggregate log/metric data rather than probing an endpoint. The Elastic (WAF logs) form, for example, offers quick templates (Traffic by country, Top URIs, 5xx errors by URI, WAF mitigations, P95 latency by domain, Top client IPs) and a rich Group by dimension picker:
3. Alarm
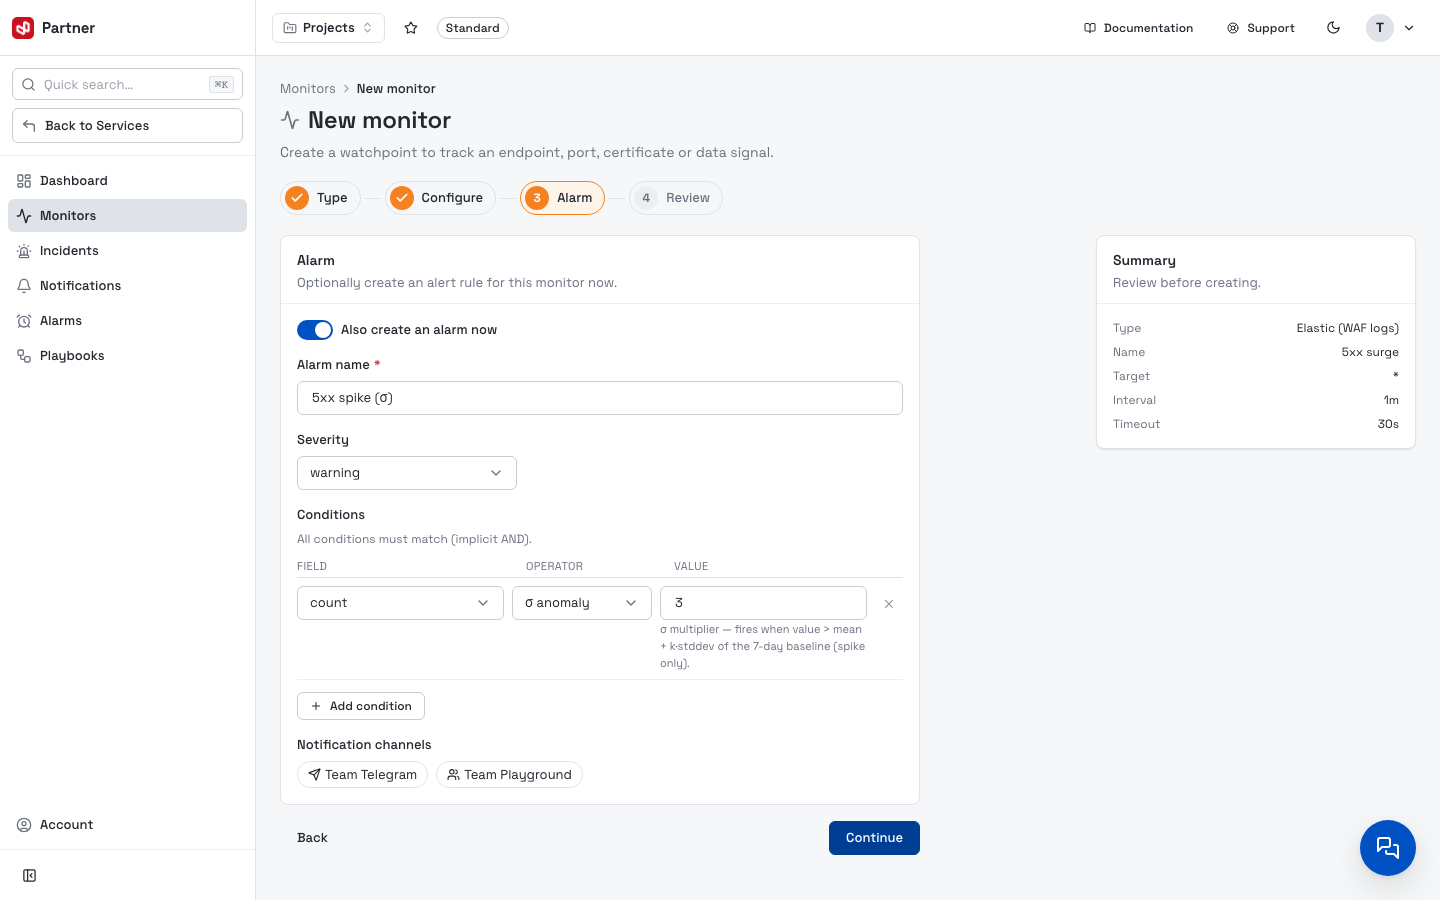
Optionally create an alert rule together with the monitor. Toggle Also create an alarm
now (on by default when you started from a template) to set a name, severity,
conditions — the same catalog-driven builder as the standalone
alarm form — and notification channels. A
template seeds a sensible condition (e.g. count σ anomaly ≥ 3); adjust the threshold and
pick a channel before continuing.
4. Review
Confirm the summary, then Create monitor (or Create monitor + alarm when an alarm is enabled). The monitor starts running on its schedule immediately — you can pause it anytime.
Monitor detail
Opening a monitor shows its health at a glance — Status, Uptime, Avg latency and Check interval — a trend chart, and the recent Check history.
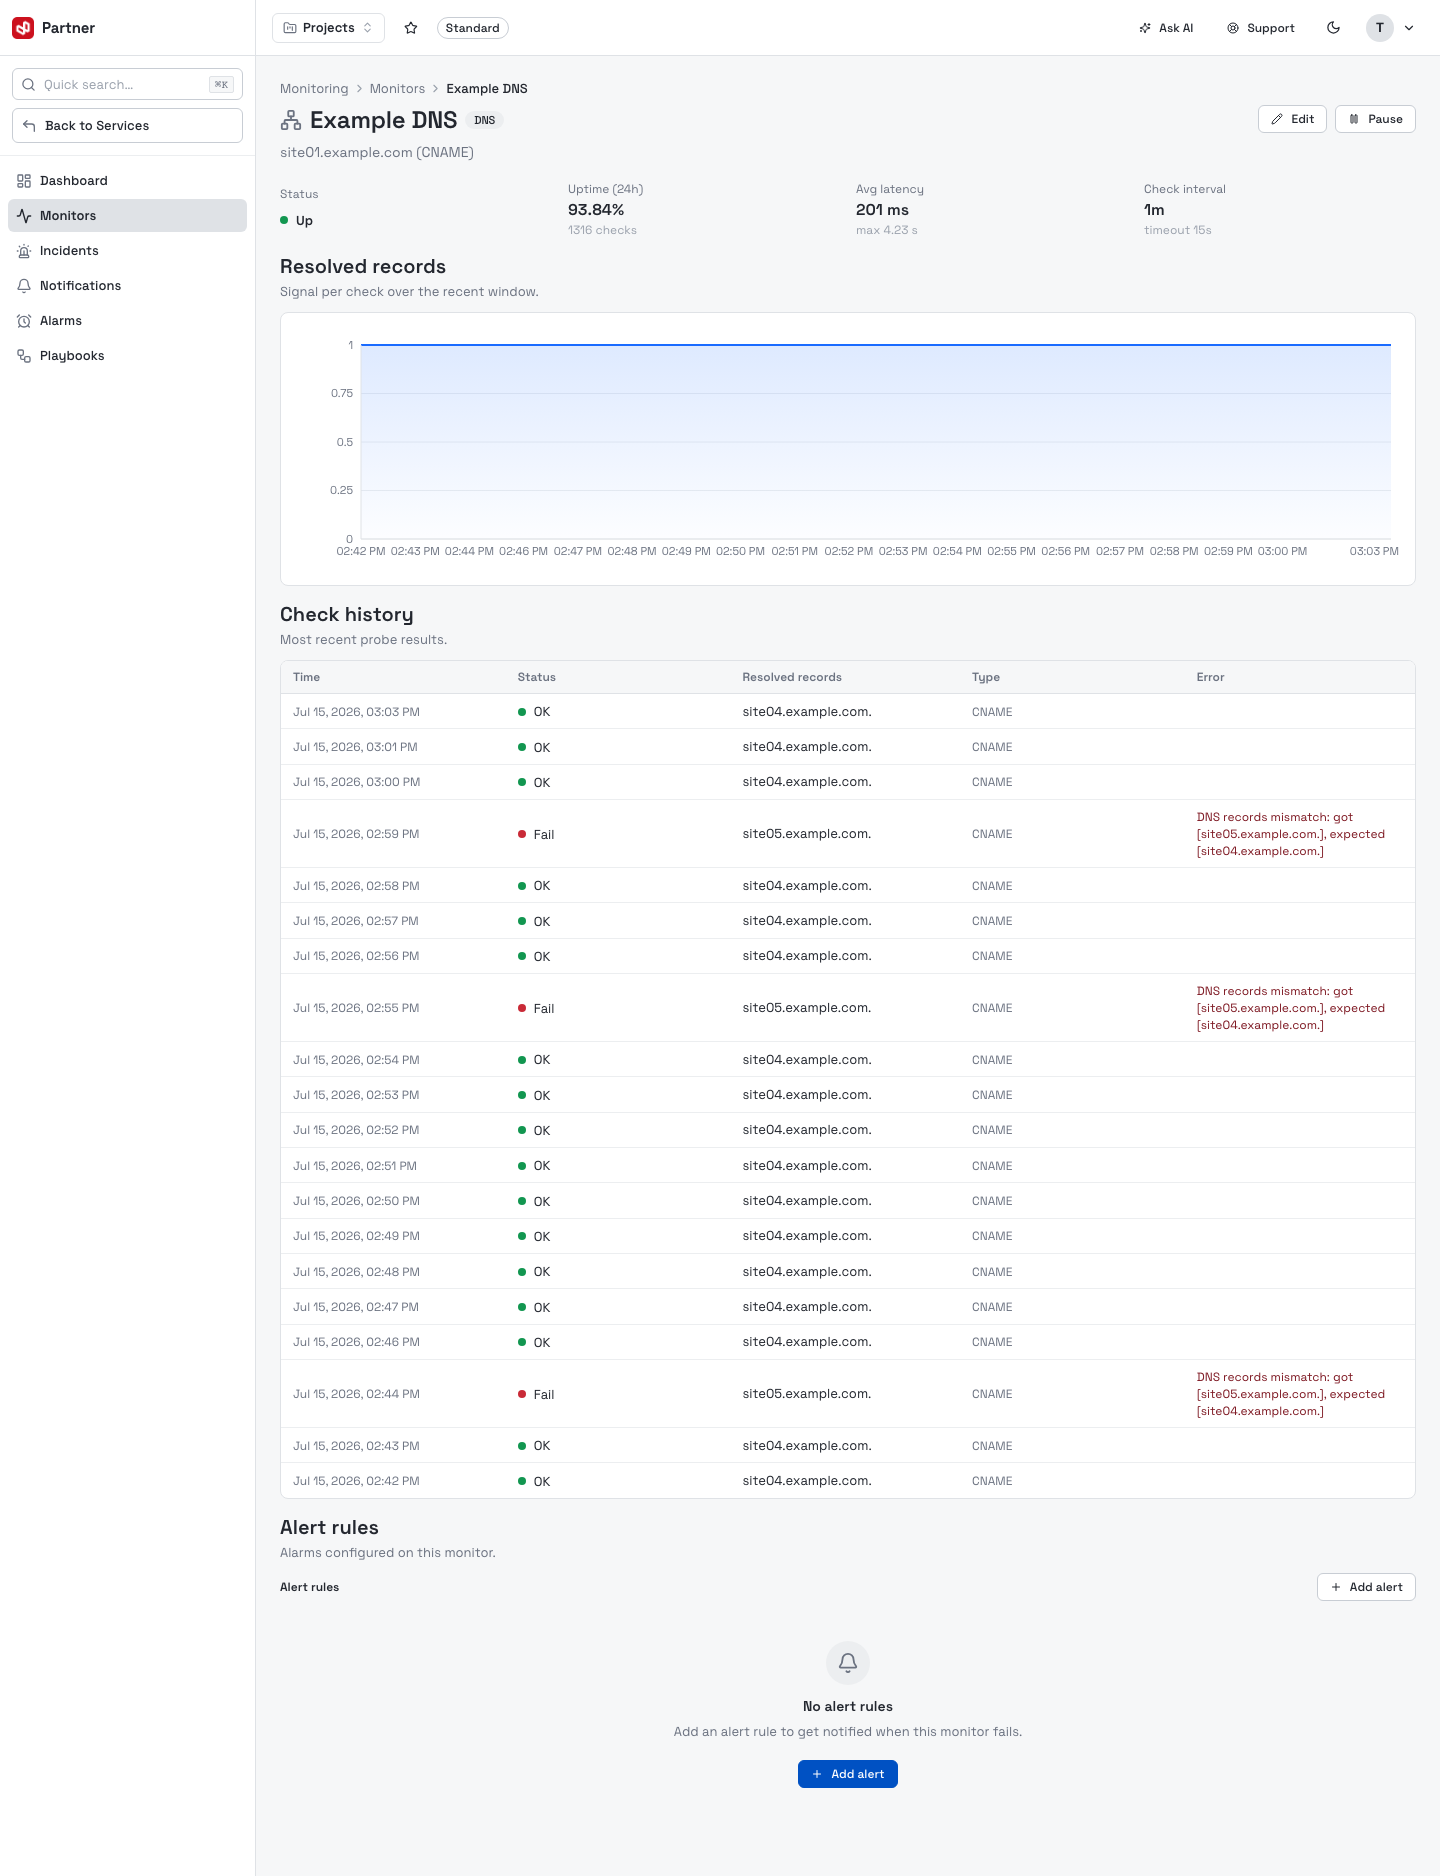
The trend chart and history columns adapt to the monitor type: protocol monitors show latency and status codes; TLS shows days-to-expiry; DNS shows the resolved records. The Baseline & suggested thresholds panel learns the monitor's normal behaviour and offers one-click thresholds (see Anomaly detection). The Alert rules section at the bottom lists the alarms attached to this monitor (add one without leaving the page).
Edit a monitor
Edit (row menu, or the button on the detail page) opens the monitor's settings. The Type is fixed after creation; everything else — name, configuration and schedule — is editable.
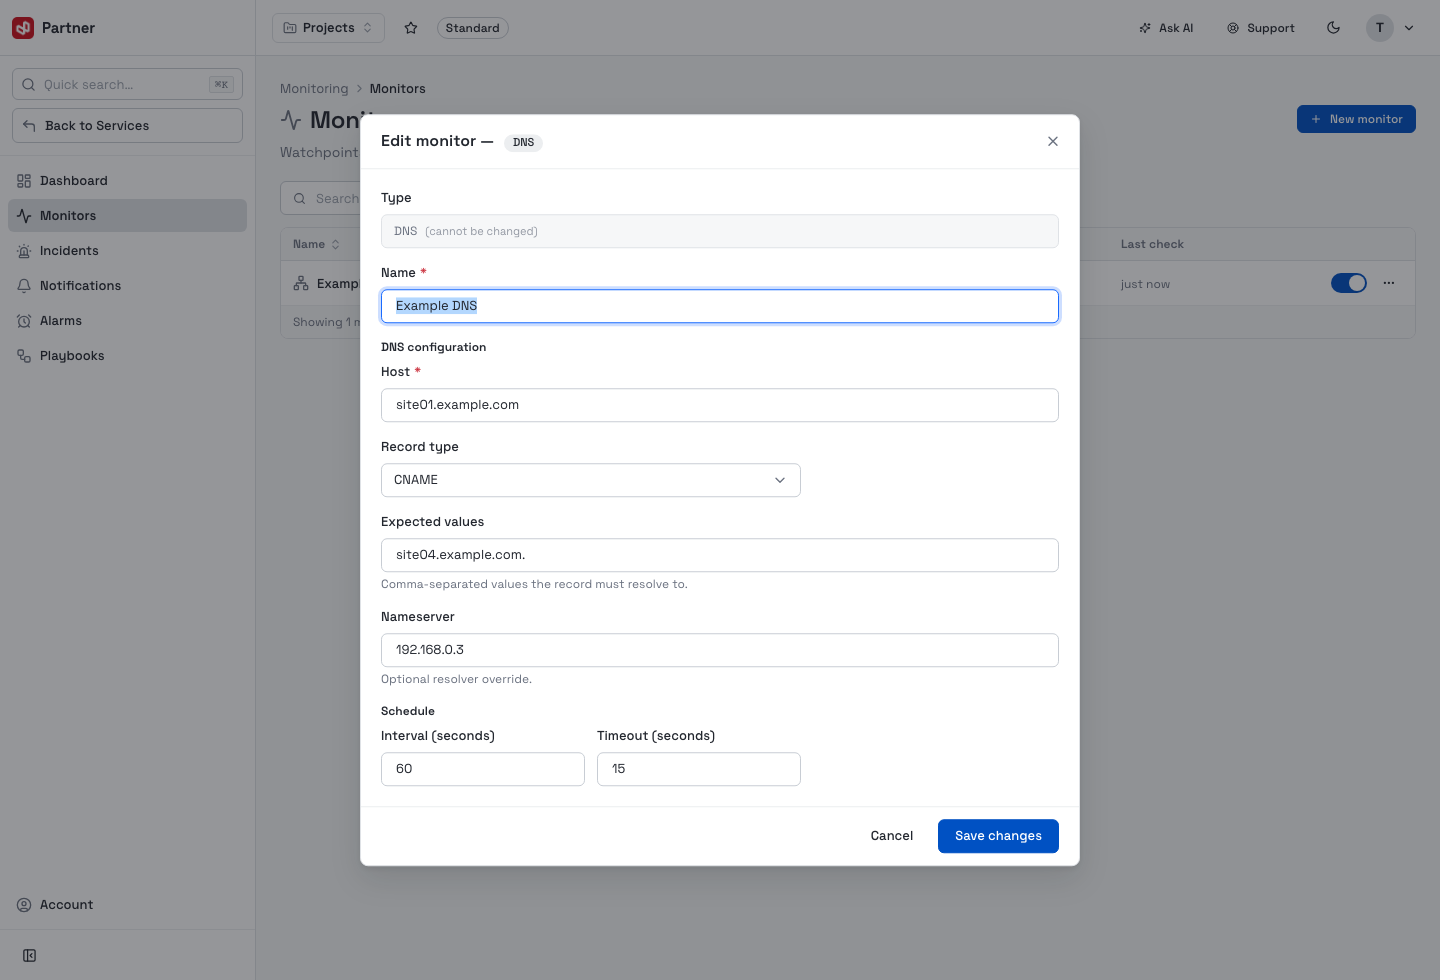
Set the Interval to how quickly you need to detect an outage, and the Timeout below your endpoint's worst acceptable response time — a check that exceeds its timeout counts as Down.