Analytics
The Analytics section has three service-scoped views, each its own nav child under Analytics. All data is aggregated across every provider backend; pick a time window (and, where offered, a specific domain) from the controls at the top.
Monitoring
Monitoring shows live edge traffic at the finest granularity — the view to watch during a launch or an incident.
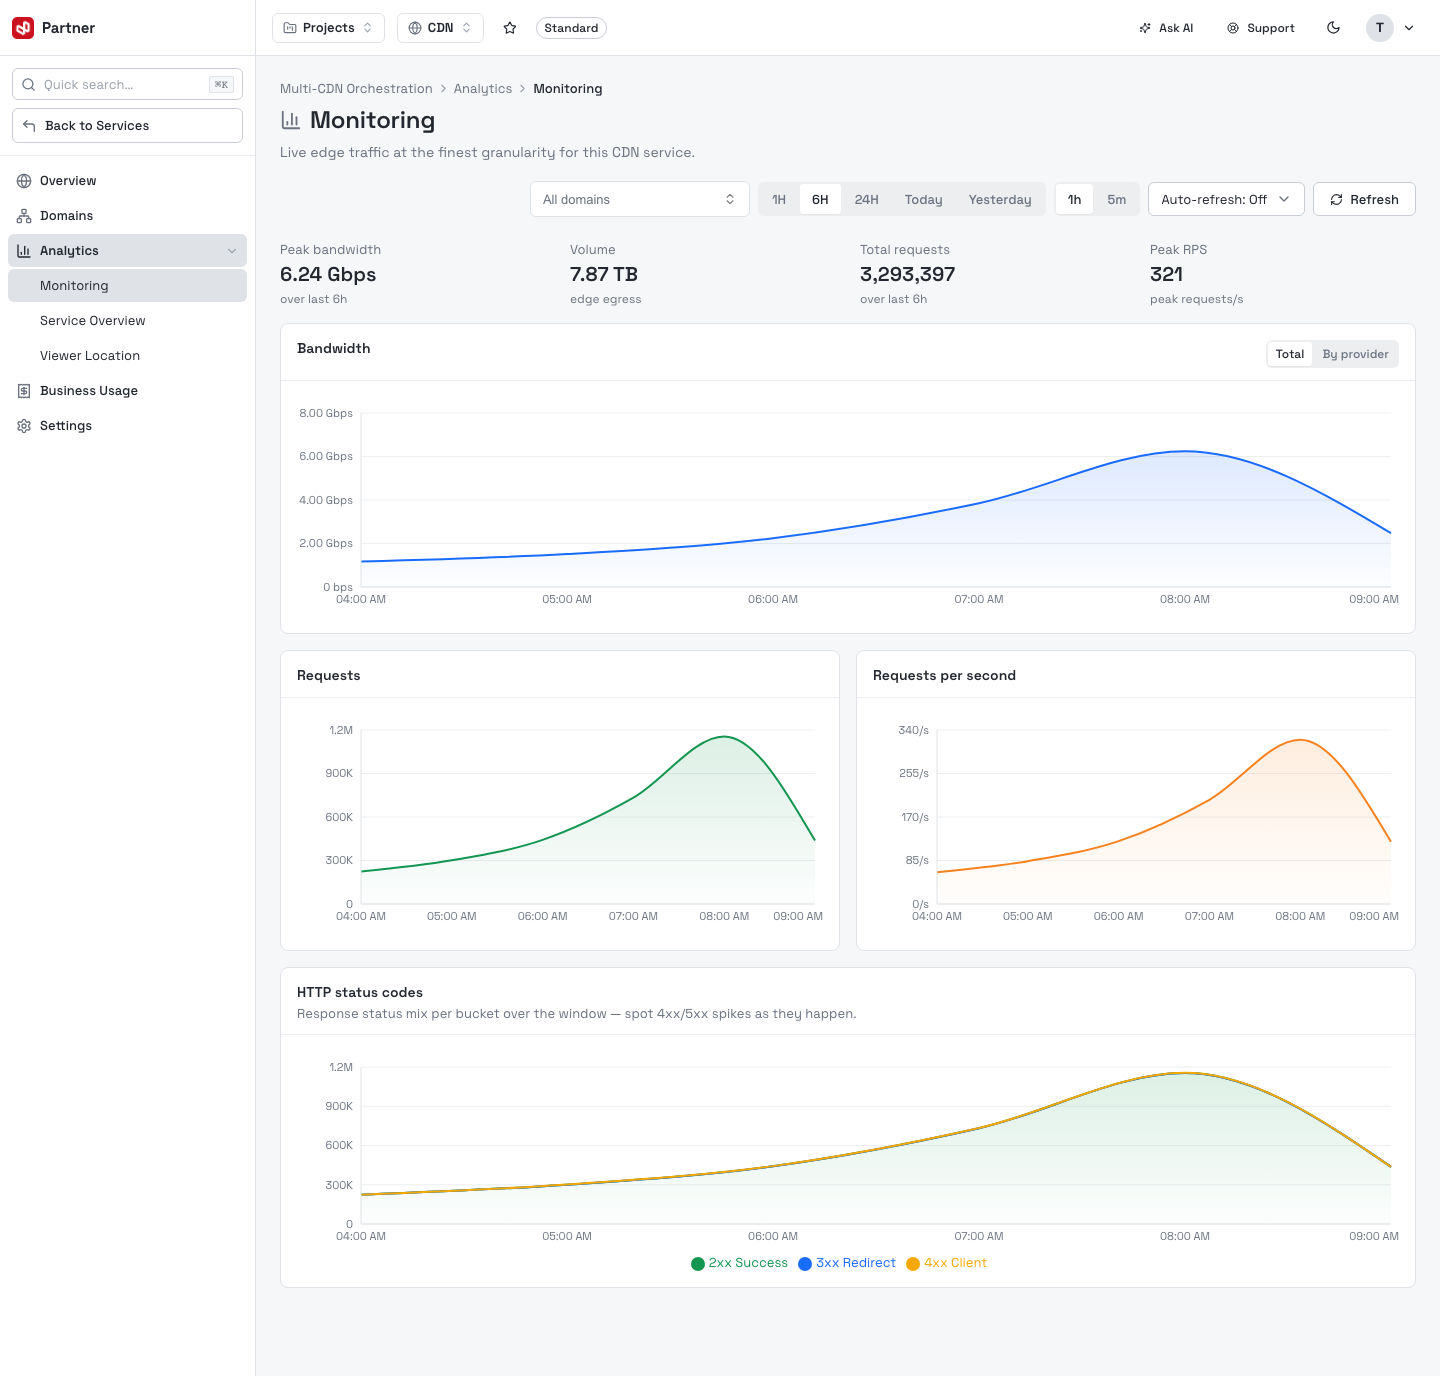
- Controls — a domain filter (All domains or one), a period (1H / 6H / 24H / Today / Yesterday), a granularity (1h / 5m), an Auto-refresh interval and a manual Refresh.
- KPI tiles — Peak bandwidth, Volume, Total requests and Peak RPS for the window.
- Charts — Bandwidth (Total or By provider), Requests, Requests per second, and an HTTP status codes area chart to spot 4xx/5xx spikes as they happen.
Service Overview
Service Overview is the aggregate picture — traffic, cache efficiency and response health over a longer window.
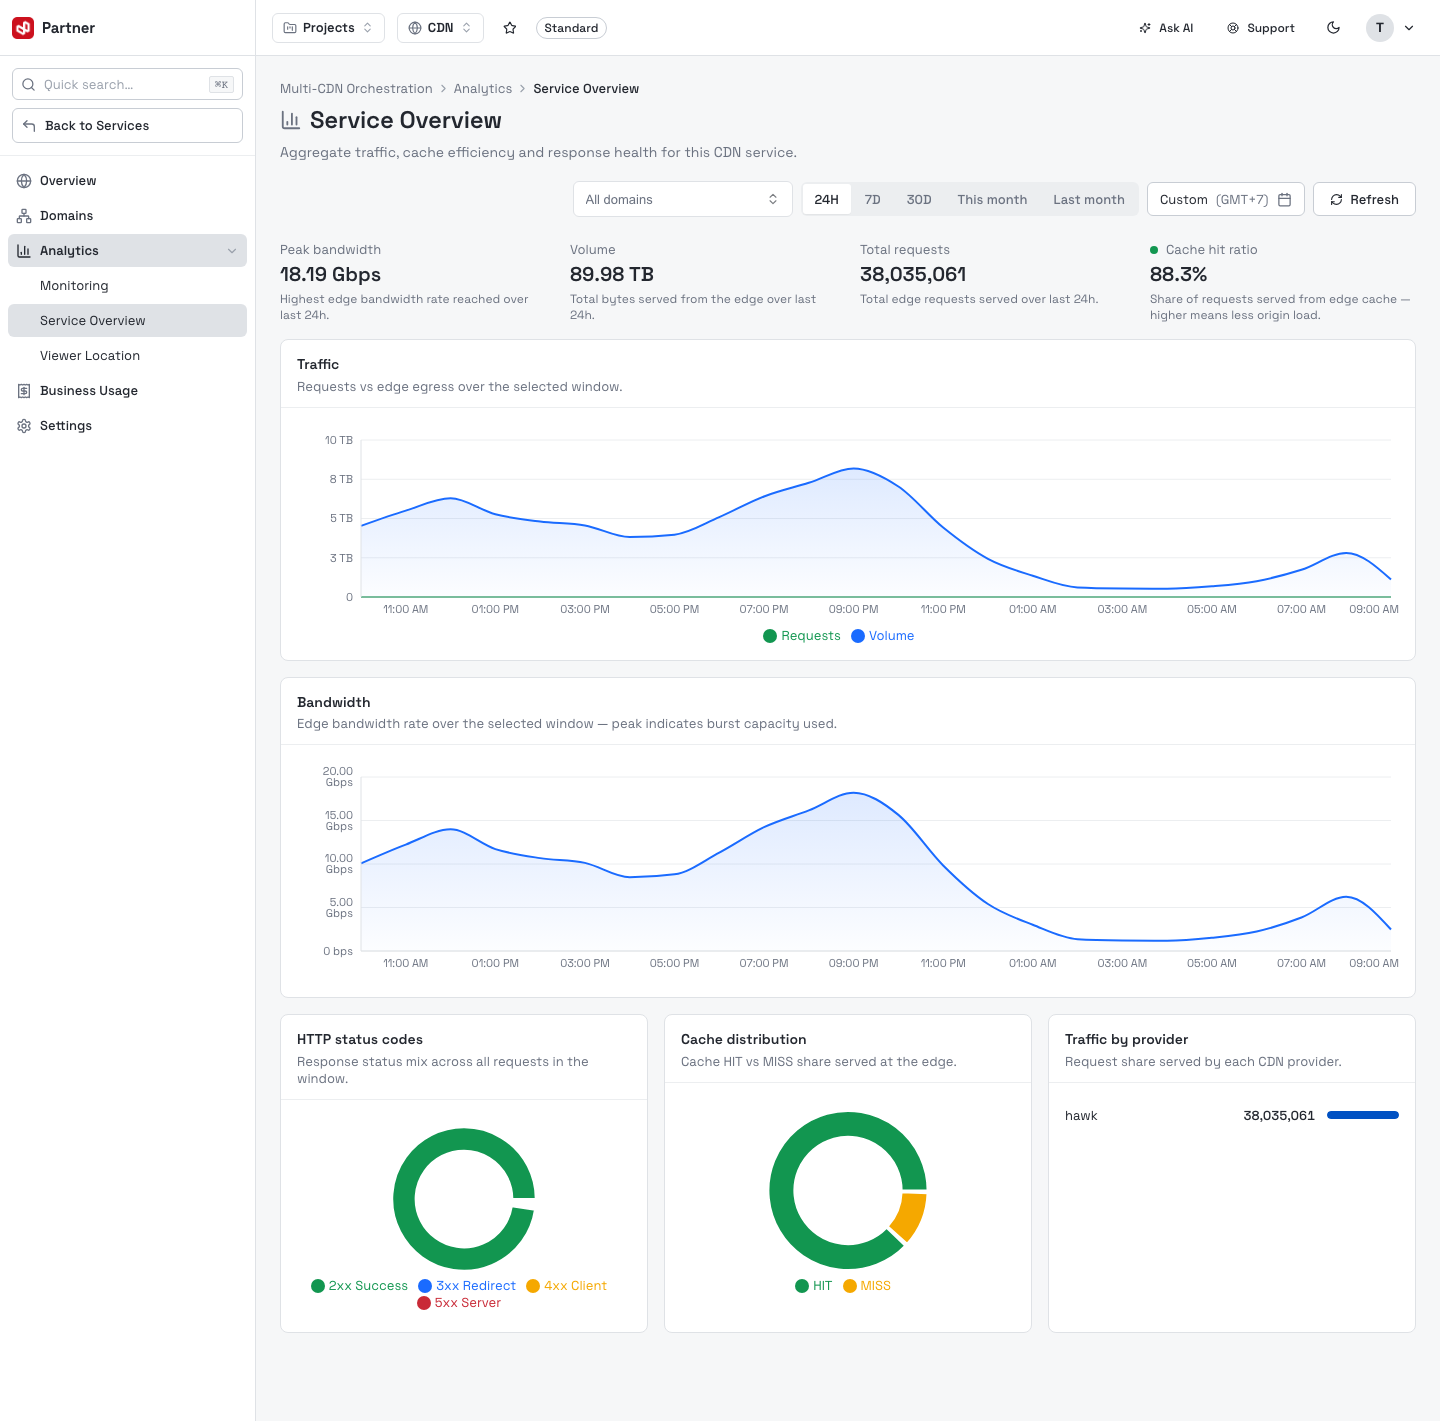
- KPI tiles — Peak bandwidth, Volume, Total requests and Cache hit ratio.
- Traffic and Bandwidth charts across the selected window.
- HTTP status codes and Cache distribution donuts (hit / miss / other), plus Traffic by provider.
- Windows: 24H / 7D / 30D / Today / Last month, or a custom range.
Viewer Location
Viewer Location shows where your audience is — request and volume share by country.
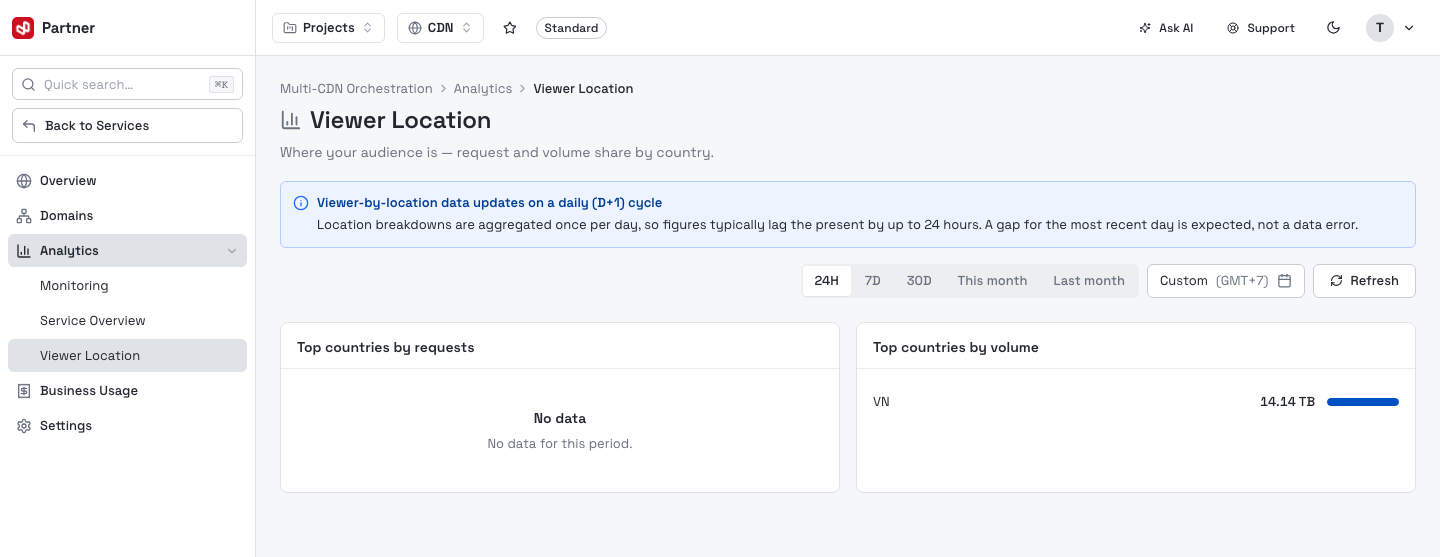
Two bar charts rank Top countries by requests and Top countries by volume.
Viewer-by-location data is aggregated once per day (a D+1 cycle), so figures typically lag the present by up to 24 hours. A gap for the most recent day is expected, not a data error.
Next steps
- Business Usage — per-domain egress billed monthly.
- Domain configuration — tune caching to lift hit ratio.